Friday, October 30, 2015

Presentation


Final Presentation

This presentation was created through everyone's contribution. 

Once Kristin and myself received all the material and information. We created this presentation for Erika and her fellow team members.


Final Presentation Script

ELLA

WHAT WAS OUR GOAL?
-To change the perception of poverty in Douglas county.

HOW ARE WE GOING TO ACHIEVE THAT?
-We have a theme of contrasting ideas in order to create accurate perceptions.

WHY THE BOXES?
-Provided interactive possibilities with the audience and an engaging dimensional presentation format

MOOD BOARD
-We chose contrasting colors to emphasize our theme of misconceptions vs reality of poverty.
-We chose easily legible fonts for clarity
-And focused heavily on infographics to make information more visual and easy to comprehend and digest for the viewer.


LIZ

FLOOR PLAN
-       Fill the space, create a dynamic walking path and addresses the topics in order of what we think is helpful to the viewer’s understanding
-       introduction, what does it mean to live in poverty, hard choices, who are the working poor, who suffers the most, how does it impact children, how does poverty impact health and health impact poverty
-       corner right space for booths for united way so they’re directed to them when they’re motivated to act
-       then goes to interactive space is a wall where people will write and post what poverty means to them after experiencing the exhibit, furthering their experience in our changing perceptions theme and making them examine what they learned.

HARD CHOICES SECTION
-       We’re going over one section in depth but the rest of the sections are formatted similarly
-       Idea behind it is that people in poverty are forced to make difficult decisions daily
-       infographics engage the viewer so they don’t have to read a large section of text and get bored
-       Formatted with generalized statement going over the hard decisions people would make in poverty
-       Leads them to interactive piece, placing the viewer in the shoes of the person in poverty
-       It does this by making the activity is making someone prioritize daily necessities in accordance to a low income and personal desires.


SIX SECTIONS interactive elements and reasoning

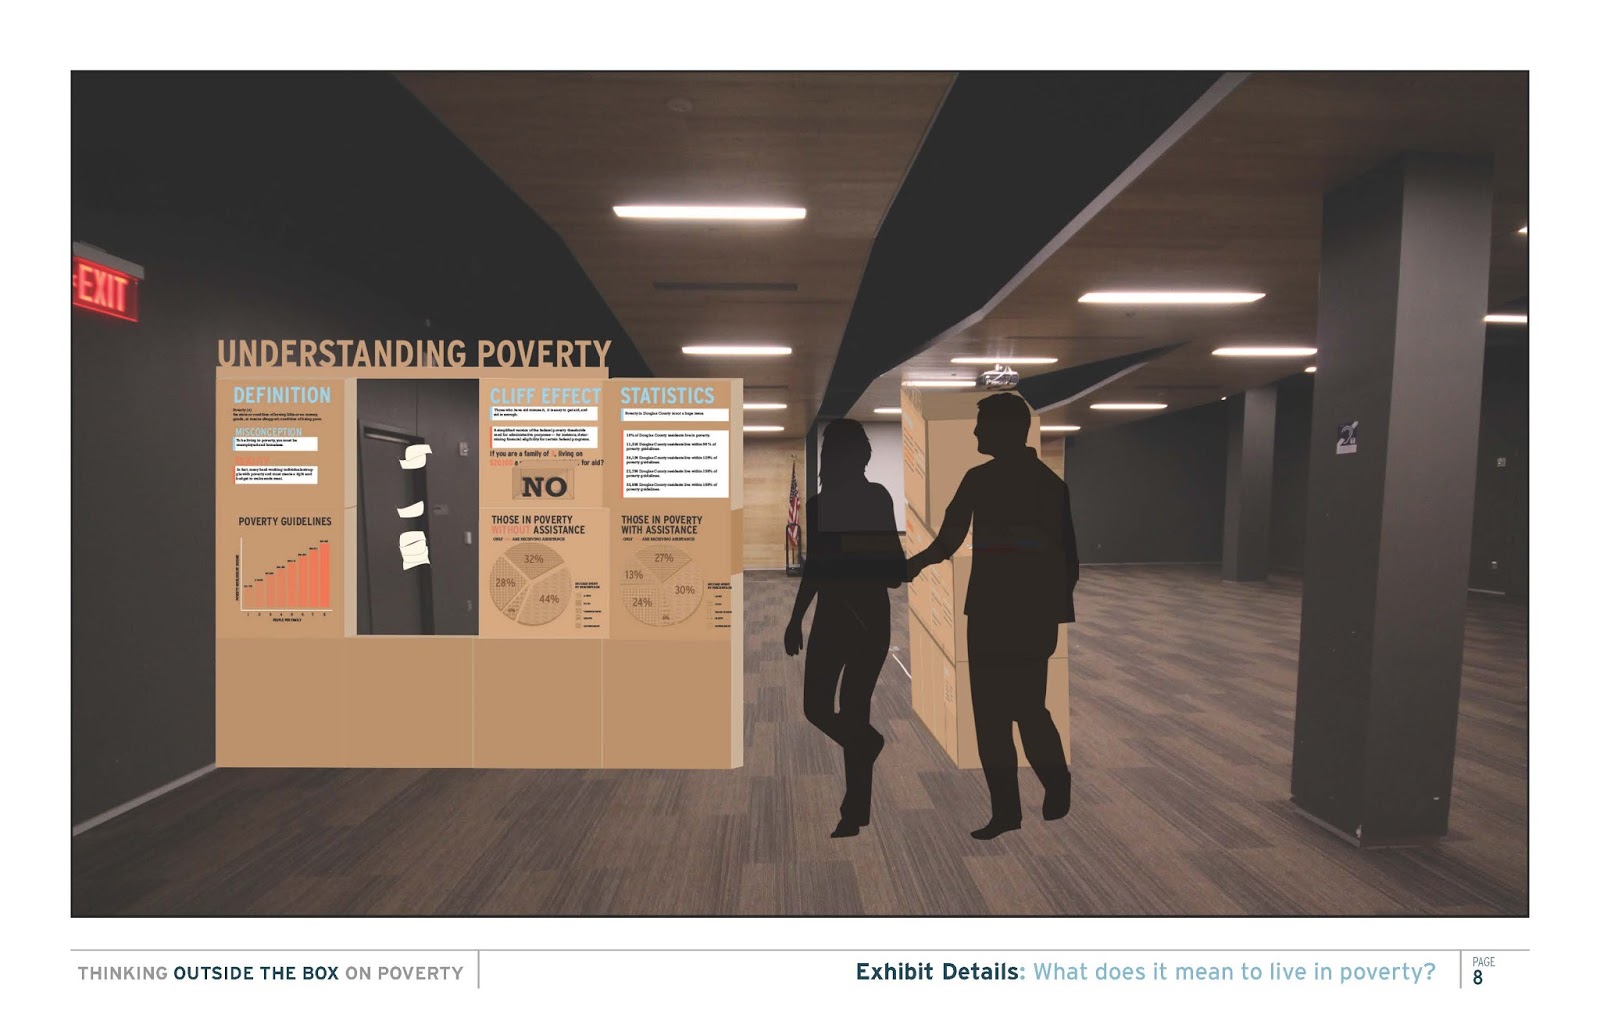
1. WHAT DOES IT MEAN TO LIVE IN POVERTY-

2. WHO ARE THE WORKING POOR-
3. WHO SUFFERS THE MOST-
Our interactive element is a physical example of the tangling of economic affects on people in different socioeconomic areas. Our visual proves that though we may seem very far away from poverty, it truly affects everyone.

4. HOW DOES IT IMPACT CHILDREN-

5.HOW HEALTH IMPACTS POVERTY (AND HOW HEALTH IMPACTS POVERTY)-
 The wire web visually represents the complex connection between health and poverty. The key social, cultural, and economical factors are physically tied together to show how they relate.


DEVON

Budget info

-Unique experience they would remember and tell their friends about,
we worked hard to make the information active and engaging with the viewer so they don’t get bored.


-Our theme of changing perceptions will make them evaluate their understanding and help raise awareness of poverty in douglas county.

User Testing

Devon, Hope, Kristin, and myself  performed user testing within the senior studio. Three users  came to go through the 'Hard Choices' section of our exhibition. The exhibition section was presented full scale and contained all the information one would view along with an interactive element.The testing began with a brief survey that asked:
  • Name/Age/Gender
  • Knowledge of Poverty within the DC area.
  • Explain Poverty in their own words.
  • What are some hard choices people make in poverty? 
  • Is poverty a result of bad decision making?
  • Do they volunteer?
They then came and examined the display.


After going through the interactive element, the users were handed one last survey to fill out. This survey asked them:
  • How much they learned?
  • Has their definition changed?
  • How much does this impact you?
  • Would you volunteer?
  • List one to three emotions evoked by exhibit?
  • Comments/Suggestions.


TIPS LEARNED FROM USER TESTING


 What was learned?
·       Those we interviewed felt their knowledge of poverty in Douglas County was limited before looking at the information. But felt confident in their overall definition of poverty. All referenced the government.
·       Most common emotions:
o   Sympathy
o   A need to help
o   Empathy
·       At the end, they felt aware of poverty in Douglas County
·       Directions for activity were clear 2 out of the three times. One person had to ask what exactly to do.
·       Most people are educated, or their perception is not entirely mis. All of those we interviewed


What we could improve on:
·       Provided a reflection at the end of each section, or a conclusion after the interaction piece. Let them better understand why this information is important. Why we have this exhibit in the first place.
·       Using more visuals, make sure we have icons (which most sections most likely have, we didn’t due to time.)
·       To make sure the instructions are precise.


Experience Design Content Review

To begin, the Experience Designers reviewed their content. This involved summarizing their specific field and finding ways to communicate visually, while also coming up with an interactive element. 

Summarized Content:

UNDERSTANDING POVERTY

Poverty (n)
the state or condition of having little or no money, goods, or means ofsupport; condition of being poor.

Misconception: To be living in poverty, you must be unemployed and homeless.

Reality: In fact, many hard working individuals struggle with poverty and must create a tight end budget to make ends meet.

General Content:

Even people living in poverty rarely qualify for aid found in the poverty guidelines provided by the federal government.

Poverty guidelines determine if an individual qualifies for financial eligibility for certain federal programs, allowing them to receive financial assistance with: 

Housing
Food
Work, etc.

*Display Poverty Guidelines Chart. 
*Highlight the 3 person household.

The Cliff Effect:

Imagine living on $20,090 a year with a family of three. If you make $100 more a year, would you and your family still be eligible for federal aid?

FLAP TO LIFT W/FINGER: Find way to indicate, arrow?

NO, this is a result of the cliff effect. 

Douglas County Stat:

Although these people are living and struggling with poverty, they are not considered among the impoverished of the state. Therefore, they are not part of the 19% in poverty that are present in the Douglas County area.


Visual INFOGraphic 

Possible other visual graphic… A compare and contrast budget system.

Pie chart that an individual will compose a budget based on the income listed above of $20,090.

Without Assistance:
6800 Food 32% of Income
8740 Living 44% of Income
1224 Transportation 6% of Income
5668 Health 28% of Income
Entertainment 0% leftover

Not sure about % of people struggling...

With Assistance:
5500 Food 27% of Income
6000 Living 30% of Income
1224 Public Transportation 6% of Income
4824 Health 24% of Income
Entertainment 13% leftover

19% Receiving assistance. 


These material was passed onto the information architects and the graphic designers. They collaborated in the overall structuring of the text.